AMS (ArchiMate, Mermaid and Structurizr) - Tools and Techniques to manage your Architecture knowledge
Table of Contents
Introduction
I come from a Agile Technical Architecture background. This means operating in a servant role for teams rather than top down. I am now exploring the Enterprise Architecture skillsets such as TOGAF to expand my knowledge and find a middle ground of how I like to work. The more you know!
As a Architect, you need to be able to wear different hats and adapt quickly to your situation. It is common to explain the same situation in numerous contexts.
Explaining a plan to a board of directors, product person and developer all entail alterating your language and context.
To get to the point where you can be effective in these conversations, you have to understand the business, its people and both their capabilities.
Below I have set out my current thoughts on how I can take different Architecture practices and merge them to hit three levels of context you need to manage when on a project.
But please bare in mind, diagrams to visualise your thoughts should be used sparingly and when appropriate. They can get out of date quickly and sometimes it is easier just to do. I cover some of these instances below in further detail.
Using AMS (ArchiMate, Mermaid and Structurizr)
I want to go over a set of tooling, techniques and ways of working I use to:
- Maintain your knowledge of the business in one place
- Provide the correct diagram to tell your story
- Prevent outdated diagrams existing in your business
- Use Diagrams as Code wherever possible
- Identify where not to use diagrams
- Store your data models where it is appropriate
There are three different tools and techniques to gather information, keep it up to date and help you tell a story to the right people in the right way:
- Archi - ArchiMate modelling language for data that changes rarely, centered around the business
- Mermaid for data that belongs in the teams and is owned by them
- Structurizr - C4 Model for data that is owned by the technical persons in teams
ArchiMate modelling language
The ArchiMate® modelling language is an open and independent Enterprise Architecture standard that supports the description, analysis and visualisation of architecture within and across business domains. ArchiMate is one of the open standards hosted by The Open Group® and is fully aligned with TOGAF®. ArchiMate aids stakeholders in assessing the impact of design choices and changes.
Citation: ArchiMate Tool
ArchiMate comes from the TOGAF landscape which lends itself to more Enterprise Architecture modelling rather than Agile Architecture.
ArchiMate and TOGAF are huge topics of which I am just starting my journey on. From what I have learnt so far, the experts at the Open Group have created a wealth best practices to learn and make your own. You can learn more on their website of how to start a training course and access to resources.
I am personally looking forward to mixing elements of TOGAF and Agile Architecture to expand my abilities. The more you know.
With the iterative development mindset in Agile ways of working, we sometimes miss a way to centralise all the key business requirements in one place, while keeping a high level view of the overall goal of our solutions.
This is where ArchiMate excels. You can use the ArchiMate modelling language to store:
- Any knowledge that sits outside of the codebase
- Data that will not change on a regular basis
- Data that you will need to present to the business in various views
Within Archi we can easily generate an ASIS model of our Enterprise to understand the complexities of the business and have a place we can revisit on a regular basis to ensure we are meeting the requirements.
Business
- Business Value
- Processes
- Services
- Actors
- Contracts
- Products
- User Needs
- Company/Department/Team structure
- Roles
- Stakeholders
Legislation
- Legal
- Policies
Organisation Strategies
- Resources
- Capabilities
- Value Streams
Motivations
- Goals
- Outcomes
- Drivers
- Values
If we know the above, we can make better decisions and help others find their way forward when building new products and features.
Archi allows us to add our data and create relationships across domain boundaries allowing us to visualise the complexities of an Organisation. Examples of some of these relationships are:
- Connect teams to Budgets
- Projects to Programming Languages and team member specialities
- External Services to internal dependencies
- Business Capabilities to team resources
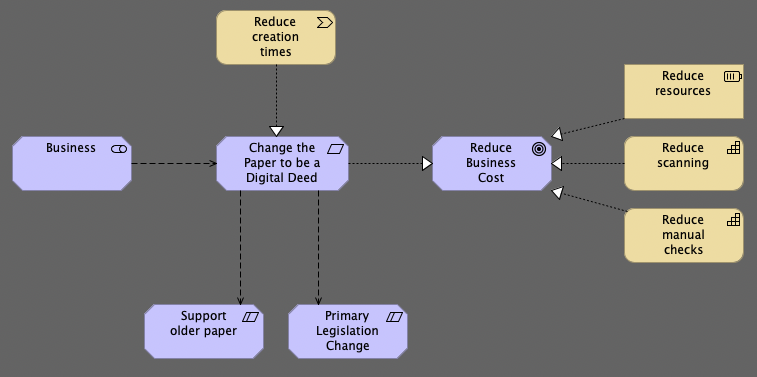
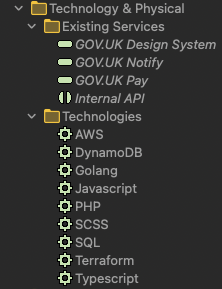
Example Data Models and Views in Archi
Below is a small set of examples of data you can store and visualise in Archi.
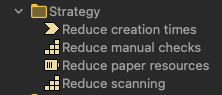
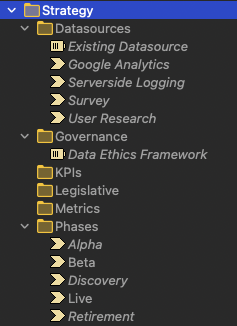
Strategy and Business needs
Define resources, capabilities and value streams, datasources, governance and any other context specific organisation strategies.
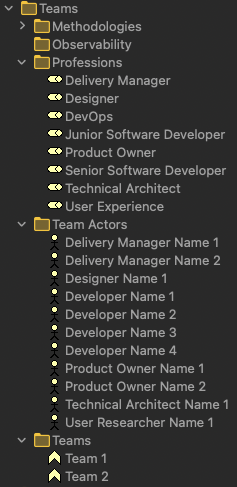
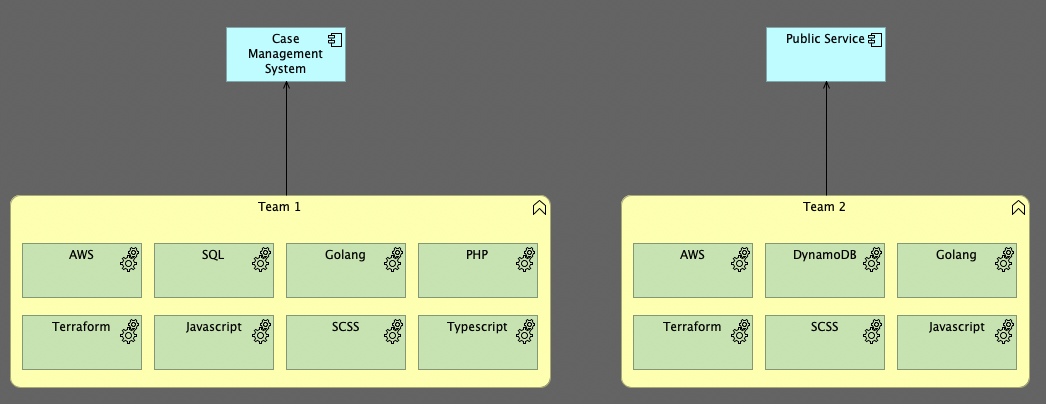
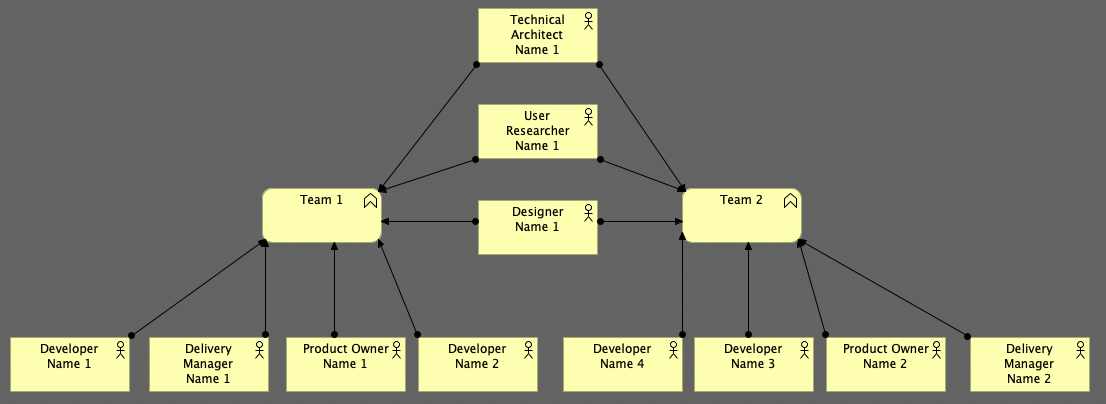
Team Capability Recording
Record the Organisations teams by Professions, Actors, Teams and methodologies to identify resources across the landscape.
Mermaid
Mermaid is a JavaScript-based diagramming and charting tool that uses Markdown-inspired text definitions and a renderer to create and modify complex diagrams. The main purpose of Mermaid is to help documentation catch up with development.
Citation: Mermaid Github repository
When you have a need to record visualisation decisions that have been collaboratively decided with your teams, you want to use Mermaid.
Mermaid allows you to create Diagrams as Code. It is a flexible language with a wealth of online tooling to help you build your diagram.
Some of the advantages to using Mermaid are:
- You can add your diagrams to Source Control.
- Works natively with Markdown.
- Maintenance and creation is everyones responsibility.
- Store in a central repository for organisation level diagrams.
- Store your product and code base diagrams alongside your code.
- Have full version history of changes over time.
- Renders in Github natively in a browser for documentation such as ADRs.
- No storing and rendering images (you can if you want).
- No additional tooling required in your pipelines to render diagrams.
- Open Source your decisions.
Below are examples of some diagrams you can create with Mermaid. Adding these to your ADRs and documentation will help those wanting to understand decisions in your organisation better.
Examples of Mermaid syntax
All the below are written with Mermaid in Markdown and rendered on the fly using Mermaids Javascript library. See the source code of this page or the links below each one for further information.
Git Graph
gitGraph
   commit
   commit
   branch develop
   checkout develop
   commit
   commit
   checkout main
   merge develop
   commit
   commit
Source code: Git Graph
Sequence Diagrams
sequenceDiagram
    autonumber
    actor Browser
    participant SUS as Sign Up Service
    participant US as User Service
    links US: {"Repository": "#"}
    participant Kafka

    Browser->>SUS: GET /sign_up
    activate SUS
    SUS-->>Browser: 200 OK (HTML Page)
    deactivate SUS

    Browser->>+SUS: POST /sign_up
    SUS->>SUS: Validate input

    alt invalid input
        SUS-->>Browser: Error
    else valid input
        SUS->>+US: POST /users
        US--)Kafka: User Created Event Published
        Note left of Kafka: other services take action based on this event
        US-->>-SUS: 201 Created (User)
        SUS-->>-Browser: 301 Redirect (Login Page)
    end
Source code: Sequence Diagram
User Stories
graph TD;
   classDef facadeCommand fill:#779fae
   classDef command fill:#aec6cf
   classDef result fill:#cfcfc4
   classDef event fill:#ffb853
   classDef domainEvent fill:#ffcb81
   classDef integrationEvent fill:#ffdeaf
   classDef query fill:#62d862
   classDef readModel fill:#77dd77
   classDef userInterface fill:#a2e8a2
   classDef aggregate fill:#fdfd9d
   classDef service fill:#fcfc78
   classDef policy fill:#b6a2db
   classDef saga fill:#c9bbe5
   classDef process fill:#ddd4ee
   classDef timer fill:#cfcfc4
   classDef person fill:#ffd1dc
   classDef system fill:#ffd1dc
   classDef comment fill:transparent

   FacadeCommand:::facadeCommand --> Command:::command
   Result:::result --> Event:::event
   DomainEvent:::domainEvent --> IntegrationEvent:::integrationEvent
   Query:::query --> ReadModel:::readModel
   UserInterface:::userInterface --> Aggregate:::aggregate
   Service:::service --> Policy:::policy
   Saga:::saga --> Process:::process
   Timer:::timer --> Person:::person
   System:::system --> Comment:::comment
Reference: https://devrants.blog/2022/08/20/mermaid-event-storming/
Class Diagram
classDiagram
    Title "1..*" -- "1..*" Genre: is associated with
    %% Added to make visibility better
    Title: \n\n
    %% Can be used to link a Domain Object to external documentation
    link Title "#" _blank

    Title "1..*" *-- "0..*" Season: has
    Title "1..*" *-- "0..*" Review: has
    Title "0..*" o-- "1..*" Actor: features

    TV Show --|> Title: implements
    Short --|> Title: implements
    Film --|> Title: implements

    Viewer "0..*" --> "0..*" Title: watches

    Season "1" *-- "0..*" Review: has
    Season "1" *-- "1..*" Episode: contains

    Episode "1" *-- "0..*" Review: has
Source code: Class Diagram
Flow Diagram
flowchart TD
    A[Christmas] -->|Get money| B(Go shopping)
    B --> C{Let me think}
    C -->|One| D[Laptop]
    C -->|Two| E[iPhone]
    C -->|Three| F[fa:fa-car Car]
Source code: Flow Chart
Quadrant Chart
quadrantChart
    title Reach and engagement of campaigns
    x-axis Low Reach --> High Reach
    y-axis Low Engagement --> High Engagement
    quadrant-1 We should expand
    quadrant-2 Need to promote
    quadrant-3 Re-evaluate
    quadrant-4 May be improved
    Campaign A: [0.3, 0.6]
    Campaign B: [0.45, 0.23]
    Campaign C: [0.57, 0.69]
    Campaign D: [0.78, 0.34]
    Campaign E: [0.40, 0.34]
    Campaign F: [0.35, 0.78]
Source code: Flow Chart
Pie Chart
pie title Pets adopted by volunteers
    "Dogs" : 386
    "Cats" : 85
    "Rats" : 15
Source code: Pie Chart
User Journey
journey
    title My working day
    section Go to work
      Make tea: 5: Me
      Go upstairs: 3: Me
      Do work: 1: Me, Cat
    section Go home
      Go downstairs: 5: Me
      Sit down: 5: Me
Source code: User Journey
Mind Map
mindmap
  root((mindmap))
    Origins
      Long history
      ::icon(fa fa-book)
      Popularisation
        British popular psychology author Tony Tony
    Research
      On effectiveness<br/>and features
      On Automatic creation
        Uses
            Creative techniques
            Strategic planning
            Argument mapping
    Tools
      Pen and paper
      Mermaid
Source code: Mind Map
Structurizr - C4 Model
The C4 model was created as a way to help software development teams describe and communicate software architecture, both during up-front design sessions and when retrospectively documenting an existing codebase. It's a way to create maps of your code, at various levels of detail, in the same way you would use something like Google Maps to zoom in and out of an area you are interested in.
Citation: C4 Model Website
If you are unfamiliar with Structurizr and C4 Modelling then I highly suggest watching the following video by Simon Brown. This 30 minute video will give you all the information you will need to get started.
How C4 Modelling works
C4 Models are a great way to describe your software architecture alongside your code base. It allows you to break down your software architecture in four levels:
- Level 1: System Context
- Shows how the software system fits into the world around it
- Level 2: Container
- Shows the high-level technical building blocks
- Level 3: Component
- Zooms in to the individual Containers showing the components inside
- Level 4: Code
- Zoom into the individual components showing how that component is implemented
In my experience, I have never done Level 4 and rarely do Level 3 unless in an ideation stage. Changes in a code base, mean without automation, your diagrams at Level 3 and 4 can become quickly out of sync and provide little value compared to Level 1 and 2.
This does not mean it would not be valuable to have these for your teams. If this is the case I would recommend looking at specific language libraries that can generate Level 3 and 4 diagrams from your code or make updating the diagrams a part of your development lifecycle.
What is Structurizr?
Structurizr builds upon "diagrams as code", allowing you to create multiple software architecture diagrams from a single model. There are a number of tools for creating Structurizr compatible workspaces, with the Structurizr DSL being the recommended option for most teams.
Citation: Structurizr Website
Using Structurizr, we can create C4 Models as Code. It is specially designed to support C4 modelling, meaning it gives us a opinionated environment to work within.
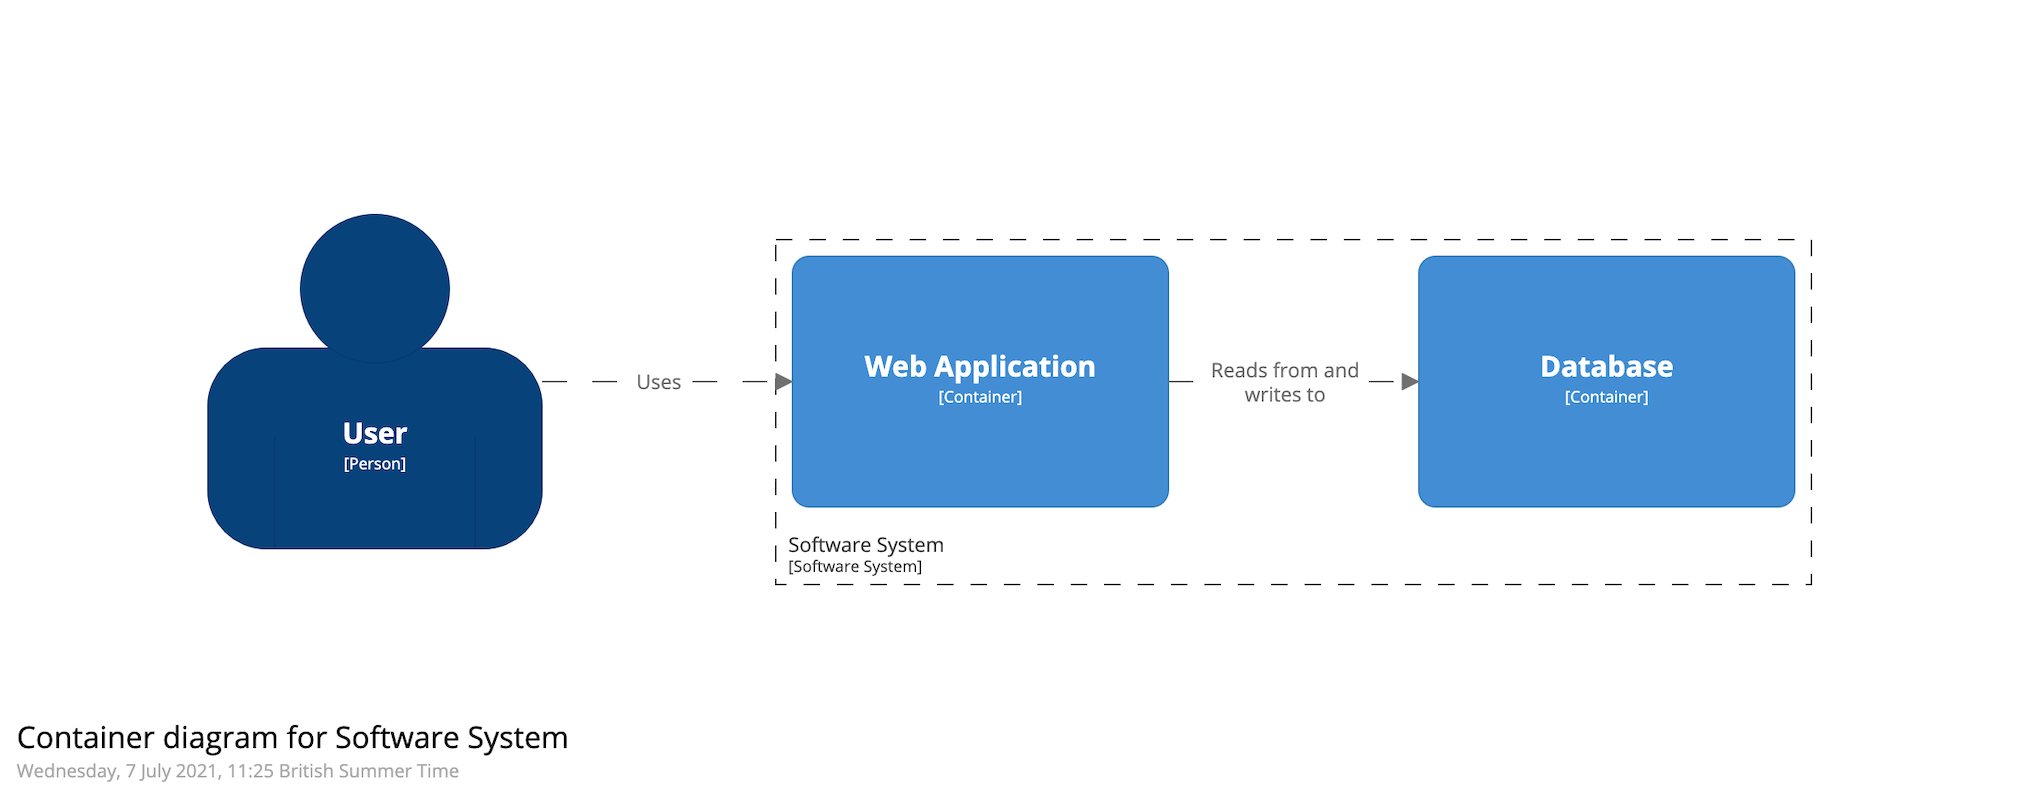
An example of how we can write a simple Software System is:
workspace {

    model {
        user = person "User"
        softwareSystem = softwareSystem "Software System" {
            webapp = container "Web Application" {
                user -> this "Uses"
            }
            container "Database" {
                webapp -> this "Reads from and writes to"
            }
        }
    }

    views {
        systemContext softwareSystem {
            include *
            autolayout lr
        }

        container softwareSystem {
            include *
            autolayout lr
        }

        theme default
    }
}
This will provide us with the following output in SVG, PNG, PlantUML or Mermaid.
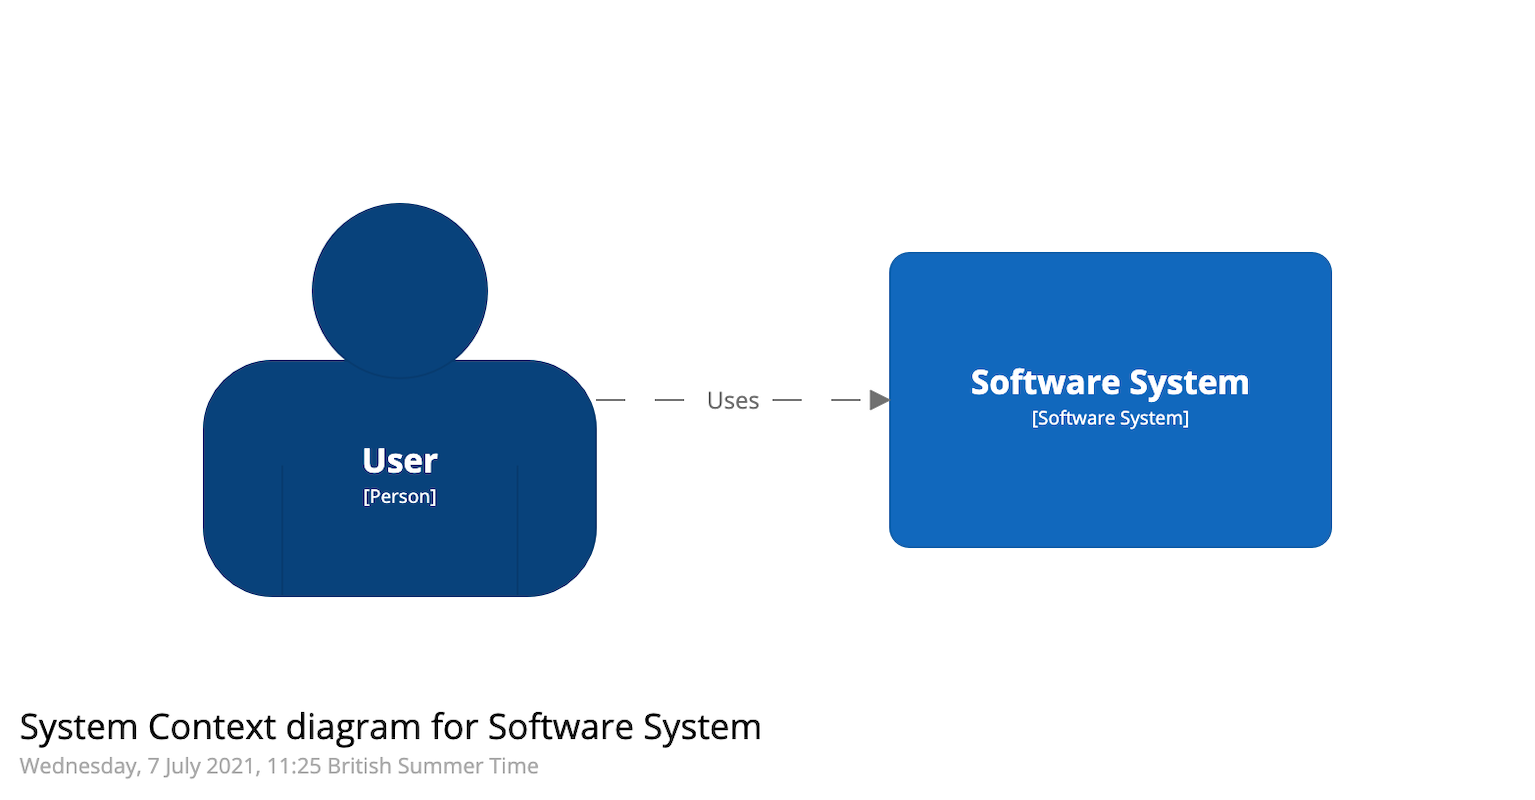
Credit: https://structurizr.com/
Credit: https://structurizr.com/
Why use Structurizr C4 Modelling as well as Mermaid?
- Reference other diagrams and models (use the !includes keyword):
- e.g. store your Actors in a central repository
- Reference other repositories diagrams
- Create a high level Enterprise diagram that references all other repository diagrams
- Structured syntax specific to C4 Modelling.
- Open Source.
- Exports to a wide range of tools and visualisations such as:
- PlantUML
- C4-PlantUML
- Mermaid
- Ilograph
- Graph view
Conclusion
There are many tools and methodologies for Architecture and each project will require different solutions to understand and solve complex problems within organisations.
With the three tools above, we can:
- Keep business and user data that changes slowly in one place to understand and visualise using ArchiMate
- Record and version collaborative ASIS and TOBE ideas in multiple visualisations with Mermaid
- Maintain a high level view of our individual and enterprise level architecture, alongside the code with C4 Modelling and Structurizr
Mixing these three tools and methods we can provide the right information to the right people at the right level of detail while also maintaining a history of our decisions over time.